A DRIVE AROUND TOWN
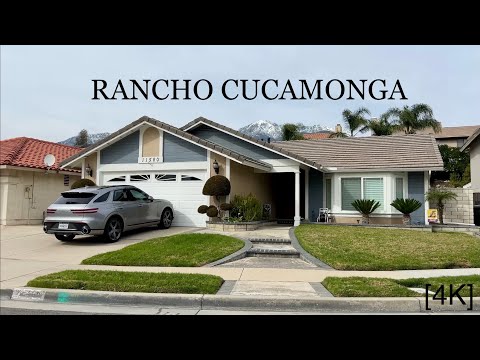
A recorded drive through Rancho Cucamonga
A recorded drive through Rancho Cucamonga offers a street-level introduction to the city. This film is a dated journey, not live road conditions.
Watch on YouTube ↗
Relocation guide
What it costs, what the weather is like, schools, outdoors and the honest pros and cons, from public data.
Population
174,693
Median age 37.9
Median household income
$109,511
Median rent
$2,286/mo
Median home value
$694,400
Schools
45
5 districts
Summer high / winter low
95° / 44°
Pros and cons come from comparisons with US medians and the city’s 30-year weather normals; they leave out things numbers can’t capture.
Rancho Cucamonga spans 4 zip codes. Median home values range from $595,400 to $860,200 by zip.
Compare zip codes


A DRIVE AROUND TOWN
A recorded drive through Rancho Cucamonga offers a street-level introduction to the city. This film is a dated journey, not live road conditions.
Watch on YouTube ↗
LOCAL FOOD · YOUTUBE SHORT
A food Short shared by Onlyintheie.
Watch on YouTube ↗It depends on what you need. Household incomes run 39% above the US median ($109,511). Property taxes are low: about 0.72% of home value a year (US 0.98%). On the other hand: Homes cost 129% more than the US median ($694,400).
The median household earns $109,511. Rent at the median ($2,286/month) is about 25% of that; a common rule of thumb is to keep rent under 30% of income, which means earning about $91,440 a year.
45 public and private schools across 5 districts. See the schools page for each school’s grades and contact details.
Highs average 95°F in August and lows 44°F in December. The most comfortable months are April, May, October.
Sources: U.S. Census Bureau, American Community Survey 2019–2023 5-year estimates; NOAA climate normals; NCES schools; OpenStreetMap parks; Recreation.gov.